How to fetch data insights and analytics from Sequel APIs
Our previous post explained the power of Sequel components and how to get started. If you haven’t, go and check it out: https://www.sequel.io/blog-post/how-to-build-your-own-video-platform-with-live-streaming-and-webrtc-using-sequel
In this article we will focus on how to fetch data insights and analytics at a user level, session level or across a company. Our platform tracks every minute of user interaction and it allows you to generate advanced graphs that can be exposed to your customers using the Sequel components. This data can also be linked with your internal system to keep consistent analytics for your users.

The analytics data can already be seen in the Sequel dashboard – Analytics tab in your account. This article is specifically for OEMs and platform builders that want to get the data from the Sequel platform and use it in their own analytics page. If you are not technical, have a look at our native CRM integrations that require no coding – https://www.sequel.io/blog-post/fast-track-qualified-leads-with-sequels-hubspot-integration
Before we get started, make sure you create a free developer account on our platform: https://admin.sequel.io/sign-up
How it works
Getting analytics from Sequel is very easy, once a user joins a session we track their engagement in the components. With our Soc2 certification and enterprise grade security, we ensure all the PII data is completely secure and only accessible by the companies that run the events. We will never target or market to these users, it is your data only. The data that we collect is minimal, only the user name, email and their interactions but we have a powerful data insights engine that generates the following analytics:
User engagement stats
- Minute by minute tracking – you can see for every minute of a live session which users were active
- Chat message transcripts
- Polls interaction
- Q&A interaction
- Networking engagement
Event statistics
- Total number of live and ondemand minutes watched
- Average duration
- Number of unique users
- Registered and participant list
- Peak concurrent
- Concurrent users for each minute
Company statistics
- Total live and ondemand minutes consumed
- Total number of unique users
- Over time analytics to track previous vs current day/week/year
- Top participant list across all events
- Sub-company analytics tracking for platforms
Coming soon!
- Chat sentiment analysis
- Word cloud
- Live reactions statistics
- Top live moments
This data is automatically stored by us with an unlimited retention policy. This policy can be changed per company basis if you wish to adhere to specific enterprise requests. For example we can clear the data after 2 weeks. This means you can fetch the historical data at any point and even run your own data insights.
Before we look at a few analytics endpoints it’s important to understand a few concepts on how we store the data. When a user attends a session they can either join a Virtual Stage or a Networking Hub. These are the two main components of Sequel and we track the interactions separately. For most endpoints you will find a `eventType` parameter that allows you to either fetch data for both of these components, or for a specific one, for example you might want to see the user engagement for all networking sessions in the past 7 days.
We also track minutes based on the engagement type. A user can view a “live” session meaning the content was live at that time, or “onDemand” which is a view that happens when the virtual stage has the replay enabled. All networking hub minutes are classified as “live” since it’s a real-time interaction with other users. This is an optional flag for most endpoints and you can specify if you wish to see “all”, “live” or “onDemand” interactions.
Important – The user engagement data is stored immediately but we run our data insights engine every hour on the hour. If you go live and don’t see the data, you have to wait for the top of the hour to see the analytics coming through.
Company level analytics
The most common use case is to fetch the total number of minutes used by a company. This could be your parent company or a sub-company belonging to your customer. For this we expose a simple endpoint that will return the lifetime usage: https://docs.introvoke.com/reference/lifetime-usage-for-a-company
If you can’t see any data, make sure you go live, watch a few onDemand replays and network in a few circles. You can also fetch data in a specific date range: https://docs.introvoke.com/reference/usage-for-a-company-in-a-date-range – this is very useful if you wish to create your own billing and charge your customers for specific date range usage.
Usage in a date range
Getting data overtime is possible at a company level across all events. These endpoints are perfect for comparing different times to understand if your usage is trending upwards or downwards and let your customers know how they are doing.
An example is the Virtual Stage and Networking usage by day:
- https://docs.introvoke.com/reference/daily-virtual-stage-usage-by-the-day
- https://docs.introvoke.com/reference/networking-usage-by-the-day-in-a-date-range
With these endpoints you can generate charts like this:

Event level analytics
Fetching data at event level allows you to get specific user engagement data like interaction with polls, Q&A, chat and minutes watched.
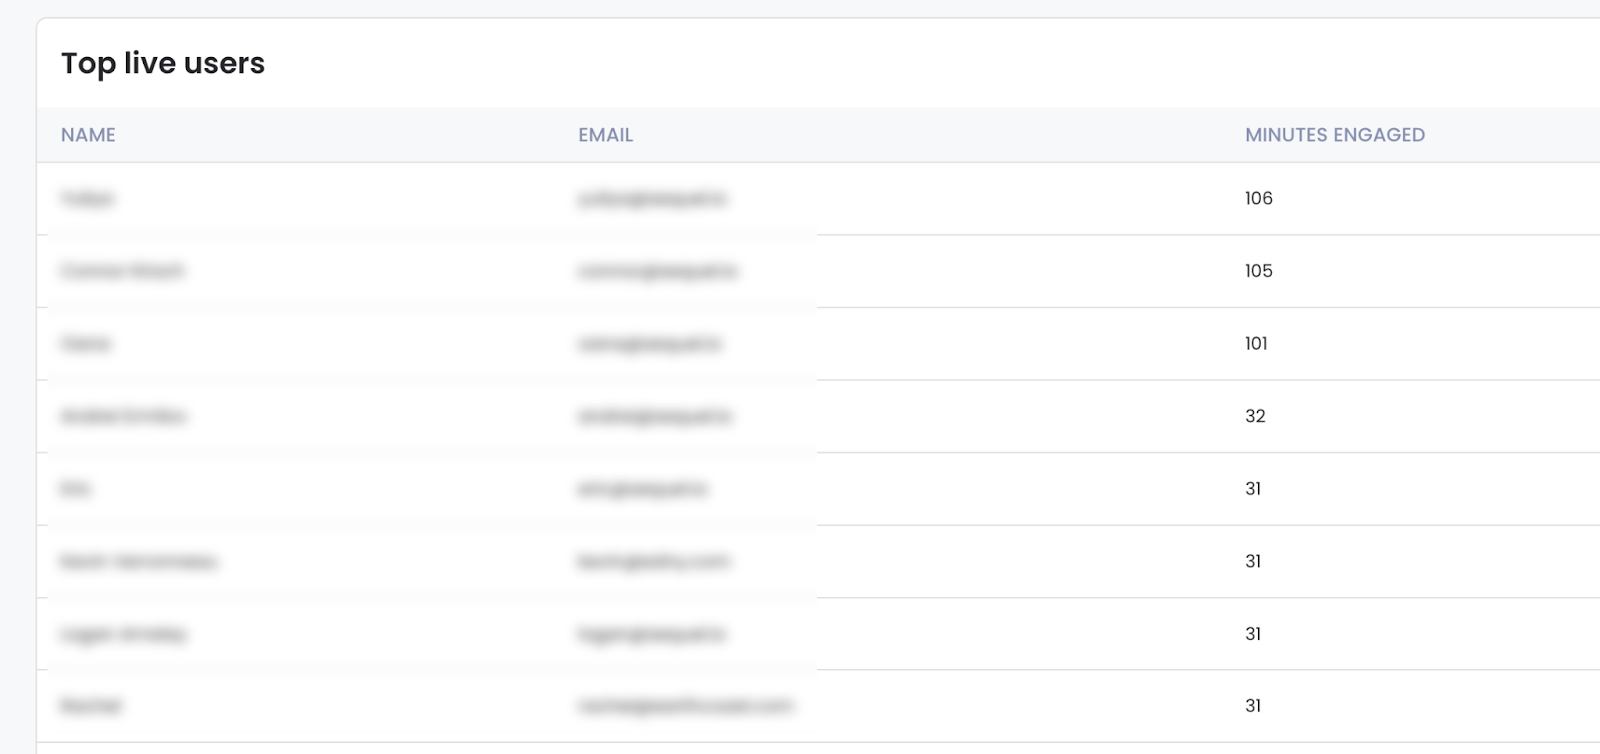
A critical use case is to understand who actually attended the session and how much they actually watched. This can be retrieved using this endpoint: https://docs.introvoke.com/reference/participant-list-with-engaged-minutes-by-event
The data returned allows you to create tables like this one and even separate between live minutes watched and ondemand
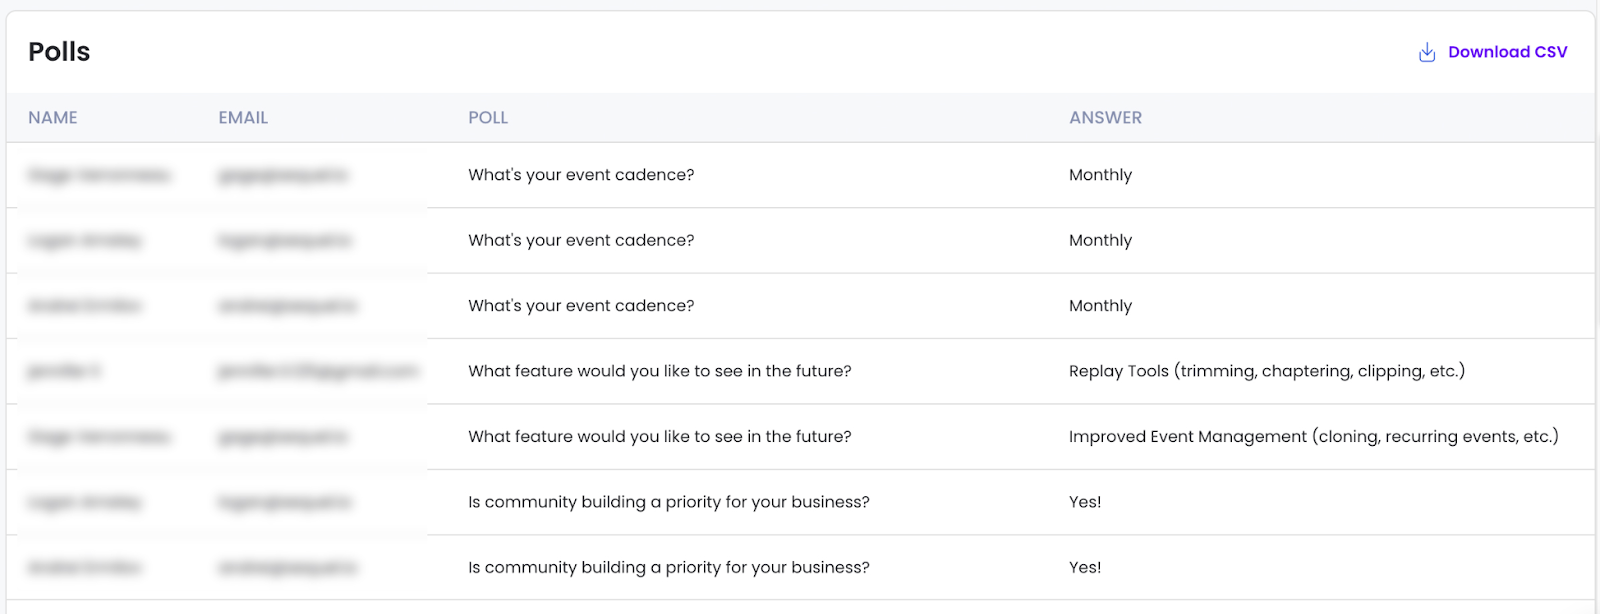
Since Sequel comes with built-in chat interactions, you can also fetch the transcripts or answers to poll questions with this endpoint: https://docs.introvoke.com/reference/eventseventidpolls
Event based triggering
The analytics endpoints explained so far require you to fetch the data. For situations where you wish to fetch data right after a session is finished, you can use our web hooks to listen to specific events. The web hooks implementation is explained here: https://docs.introvoke.com/reference/getting-started-with-sequel-web-hooks
The Virtual Stage event ended hook will notify you when an event has finished but it will also contain the participants list in the payload:
The full implementation is explained here: https://docs.introvoke.com/reference/virtual-stage-event-ended
Next steps
Looking for more advanced analytics? Direct CRM integrations or custom events? Book a demo with our technical team and we can discuss your specific needs.